Figure 28.1. Standard Reports
Reporting |
Help Contents |
The reporting functionality is
located under the Reports menu. The main reporting sections are
Standard Reports, Scheduled Reports, Saved Reports, and
System Reports. Depending on your system configuration, you may only have access
to some of these reporting sections.
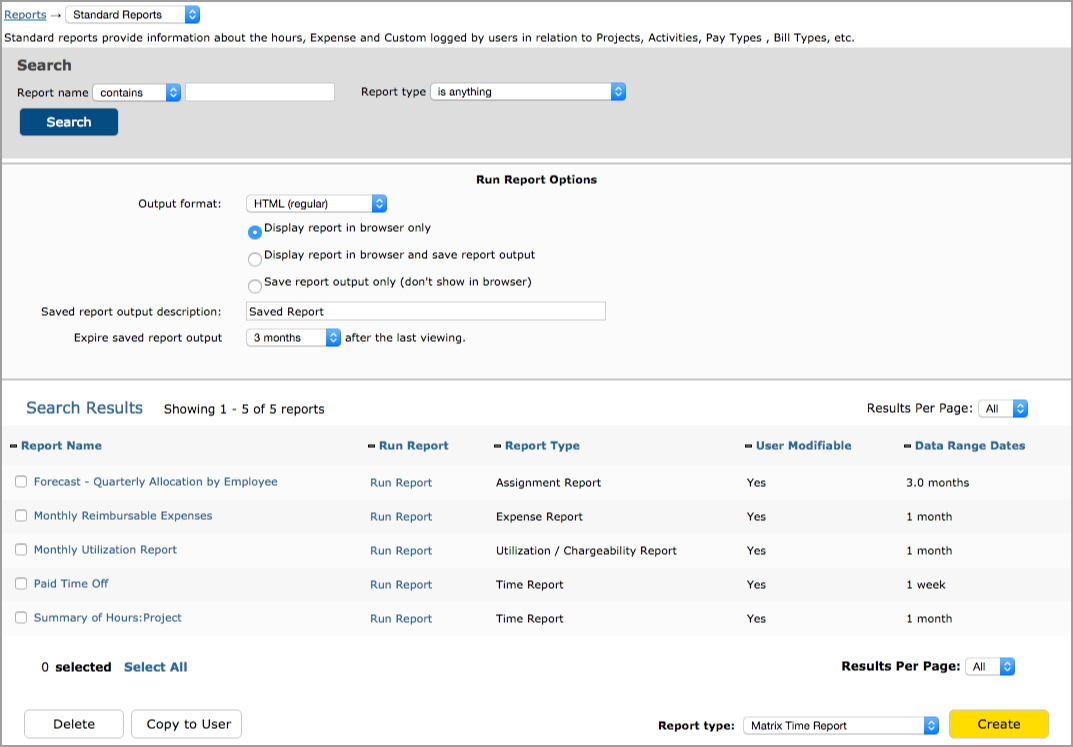
Standard Reports is located under Reports-->Standard Reports (see figure 28.1).
Figure 28.1. Standard Reports
To run a report, you must select the output format for that report. There are five main output formats for reports:
Each of these report formats are described in more detail below.
Once you have selected the report to run and have indicated which report output format you desire, simply click the Run Report link next to the selected report. If the report has been given a specific run date, the system will then generate the report and display it in your browser window. If the report has been created to request a date range, the system will display the Report Date Entry screen.
This screen is used to select the dates that will be covered by the report being run. The default begin date for reports is the first day of the previous month. The default end date for reports is the last day of the current month. To change these dates you may either enter a date manually using 'mm/dd/yyyy' format, use the popup calendar by clicking the Calendar icon next to the field, or use one of the date shortcuts in the select lists below the fields.
When running a report that will request a date range, you may choose to run the report for either a date range or an interval. If you choose to run the report for a date range, simply enter the start and end dates that you want the report to cover. If you choose to run this report on an interval, select the start date for the report and then use the length and interval select lists to select the interval that you would like the report to cover.
The default output format for reports is the HTML Report format. This format uses the web-based nature of Journyx itself to produce a report that is simple to read and matches Journyx's look and feel. Every report in the system, from the standard default reports to any custom report created by any user, can be displayed as an HTML Report. These reports show the data that they have been configured to show in an easy-to-read layout. Furthermore, the HTML Report display screen contains the following tools for use with these reports:
NOTE: The Commit button is displayed in reports based on a system setting to show or hide the button. If Sheet Approval Plans are in use, Journyx does not recommend using the Commit functionality in conjunction with workflow approvals.
The second standard
report output format is the HTML Printable report. This format, which is easily
viewable on screen, is designed to be printed. The look and feel of the product
has been stripped away in this report format, leaving a simple table appearance.
To print a report in this format, simply use your browser's Print function. The
report will be printed as it appears on the screen. This format is particularly
useful for keeping hard copies of reports. It can also be used by individual employees
in conjunction with the My Timesheet report to generate a faxable timesheet.
Journyx also includes the Plain Text (Exported) report format, which is designed for producing data that can be saved to your computer's hard drive and then imported into another program, such as Microsoft Excel, for data manipulation. When you run a report using the Plain Text (Exported), Journyx will display the data as a tab-delimited file. From the report output screen, you should use your browser's Save As command to save this data to your computer.
By default, the file name will have
a .pyc extension. This is simply the name of the file that the system uses to
generate the report output.. You may leave the .pyc extension as part of the file
name or you may change that extension. In any case, the resulting file will simply
be a tab-delimited text file that you may then import.
Cube Reports contain a dynamic report output form that allows you to sort and view your data. Cube Reports make use of Excel Pivot Tables. Therefore, the computer that you are using to view Cube Reports must have a Windows operating system with Microsoft Office 2000, including the Office Web Components module, or later installed. Additionally, you must use Internet Explorer 5.5 or later to view Cube Reports successfully. Finally, Internet Explorer must be configured to access data sources across domains. For help configuring this IE security option, please contact your organization's IT department.
Cube Reports allow you to view your data within your browser as an Excel Pivot Table. Microsoft Pivot Tables make it easy to change the subtotal options of a given report in real time. Furthermore, you can sort your results or hide individual users, dates, activities and the like. Finally, The Cube Report format also allows you to export the results of a specific report directly to Excel, where you can have complete control over the data to make graphs or drill down further.
Hint: When you export a Cube Report from Journyx into Excel, the complete selection of raw data covered by that report is also exported - usually to Sheet 2 in the workbook which is created during the export process.
Interaction with the data presented in a Cube Report is handled via the Cube Report Toolbar. Additional help with the pivot table technology behind Journyx's Cube Reports can be accessed by clicking the Help button.
To modify the subtotal option dynamically, click the Field List button on the report toolbar. The Field List screen will be displayed and you will be able to select additional fields to show in the report. Initially, only the fields that are included in the report are displayed in the report. However, by default, all standard fields will be listed in the Field List Screen and are able to be added to the active Cube Report. Simply drag the desired field from the Field List screen to the Filter Fields portion of the Cube Report. The system will automatically re-subtotal the report based on the choice you make.
To export the data displayed by a Cube Report to Excel, click the Export to Excel button on the report toolbar. You may receive a security warning from IE indicating that the data you are about to transfer is located in another domain. If you receive this warning, you may safely click 'Yes' to continue. Once the data has been imported to Excel, you may work with it independently of the system. Please note that running a Project Status Report as a Cube Report is a special case because the hierarchical nature of this report cannot be represented accurately in Excel. Therefore, this report in this format cannot be represented well as a Cube Report. The WBS field shown in this report combination is a numerical representation of the hierarchy. Journyx has included the ability to run this report combination so that you may easily export the data contained within a Project Status Report directly into Excel. If you are unfamiliar with Pivot Tables or need further information on this subject, please see the Microsoft web site or your organization's Excel documentation for additional assistance.
You can save the output of a report with a fixed date range for later viewing. Saved reports can also be copied to other users or even emailed to other individuals, even if they are not Journyx users. The following section describes all of these functions.
Saving Reports
To save a report in Journyx, select either 'Display report in browser and save report output' or 'Save report output only' without displaying in browser (see figure 28.2). Additionally, you must designate a name for the saved report for identification purposes. By default, the system will name the output file with same name of the Saved Report. You may change this name. The last option determines when the saved report will expire and be automatically deleted from the system. Saved report expiration defaults to 3 months, but you can change the expiration to suit your needs.
Figure 28.2. Creating Saved ReportsOnce you have selected the report format, chosen the method for saving and specified the name , click the Run Report link next to the selected report. The report will run and the output will be saved for later viewing. Please note that the report data is saved at the time you run the report. Therefore, any modifications you may make to the report after it has been run (i.e., changing the subtotaling options when using a Cube Report) will not be saved. To save reports that have been modified after the initial run, export the report data to Excel or another similar program.
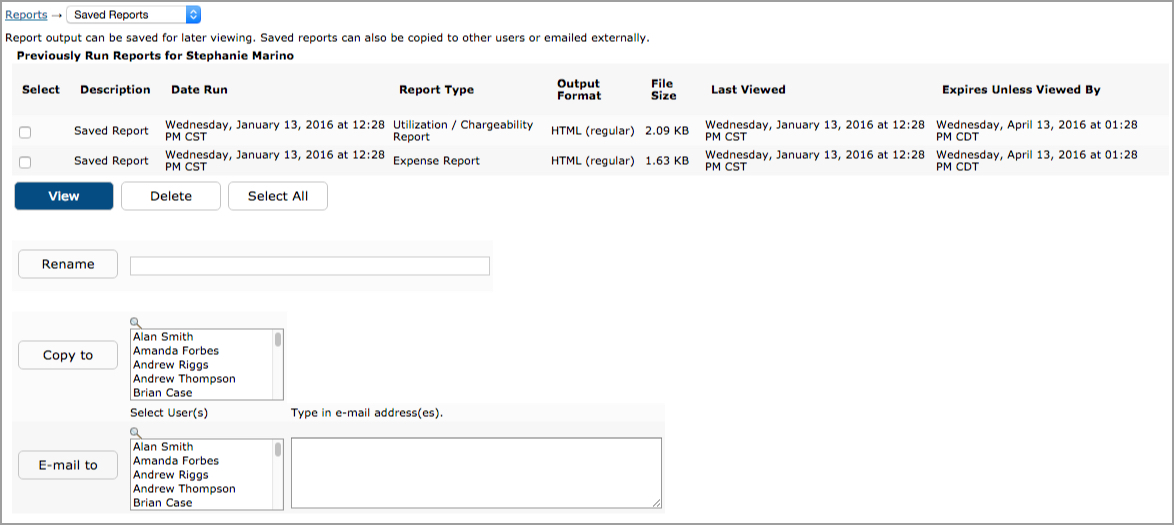
Existing Saved Reports can be seen by navigating to Reports-->Saved Reports (see figure 28.3).
The list of saved reports, located at the top of this screen, includes all reports that you have saved, as well as any saved reports that have been copied to you by another user within your organization. This screen includes the following information on each saved report you, as a user, have access to: report name, date run, report type, output format, and file size. This screen also provides access to the tools needed to copy or email saved reports to other users both within and outside the system database. To view a previously Saved Report, simply select the report you wish to view from the list of Saved Reports and click the View button.
Figure 28.3. Saved ReportsCopying a Saved Report to Users
You can copy your saved reports to other users in the Journyx system. To copy a report to another user, select the report you wish to copy from the list of saved reports. You may then select one or more users shown in the select list. To select more than one user, ctrl-click each name in the select list. Once you have selected the user(s) you wish to copy this Saved Report to, click the Copy To button. When copying a single report to other users, you will be able to rename the report for those users. However, when copying multiple reports to users, you will not be able to rename the report for those users.
Emailing a Saved Report
Saved Reports may be emailed to anyone with a valid email address. Before you can email a saved report, the system requires the following items be established in the system:
- Email System Settings
- Fully qualified domain name of server
- SMTP mail server name
- Custom Fields
- Your email address
- Email address of recipient
Without your email address and the System Settings configured, you will be unable to email any Saved Reports. Additionally, you will not be able to email Saved Reports to other users who do not have an email address entered for them in the Custom Fields section of Journyx. For these users, as well as anyone who is not a user within your organization's Journyx installation, you may manually enter email addresses in the text field located to the right of the user select list. Email addresses entered into this field may be separated by commas, semicolons or carriage returns. You may also utilize the User select list and the email text entry field in combination. One you have selected the Saved Report you wish to email and have indicated which users or email addresses you would like to send the selected report to, click the Email To button. If any users you selected from the user select list do not have an email address entered in the Custom Fields, the system will display a red text error message indicating which users were not sent the Saved Report. Emailed Saved Reports arrive as attachments within the email itself. The format of the attachments varies depending on the output format of the saved report that was mailed. HTML Reports arrive as plain HTML files that contain the contents of the report. These function exactly like HTML reports as discussed above. HTML Printable reports arrive as plain HTML files that contain the contents of the report. These function exactly like HTML Printable reports as described above. Cube Reports arrive as an HTML file and an XML file that combine to create the Cube Report. These function exactly as Cube Reports as discussed above, including the limitations associated with this report format. Plain Text (Exported) reports arrive as a tab-delimited .txt file that contains the contents of the report. These files can be imported into Excel or another similar program.
If you encounter difficulties emailing Saved Reports because either the Email System Settings have not been set for your organization's installation of Journyx or because you or your intended recipients do not have email addresses defined within Custom Fields, please contact your system administrator to correct these issues.
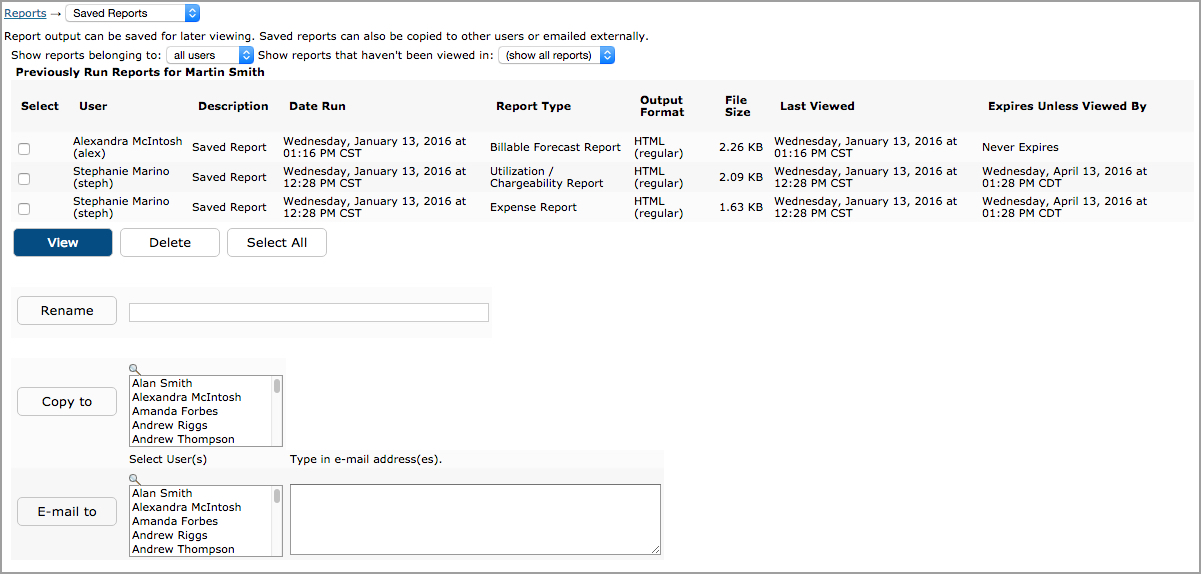
Administrator Management of Saved Reports
Administrators have some additional options on the Saved Reports screen.
Figure 28.3.1. Saved Reports for AdministratorsAdministrators have the option to view saved reports for all users in the system, and they can use their Saved Reports area to delete old reports and clear up space on the Journyx server. The select list at the top on the left side allows Administrators to view their own saved reports or saved reports for all users. The select list at the top on the right allows Administrators to see when saved reports were last viewed by anyone in the system. Reports with expiration dates will be deleted from the system if they are not viewed before the expiration date. If a report is viewed by someone, the expiration date will be reset. Expiration dates are set by the user when saving the report. All of these options allow Administrators to ensure that the Journyx server doesn't get cluttered with old and unused saved reports.
Scheduled reporting
is located under Reports->Scheduled Reports (see figure 28.4).
You can
schedule reports to run automatically at specific times. This feature can be used
in any number of ways, though the most common reason for scheduling reports is
to arrange for large reports to run at times of low traffic. The Scheduled Reports
Screen provides access to all the tools needed to schedule reports to run at specific
times, dates or intervals. This screen is used to schedule one report at a time.
The basic process of scheduling a report is outlined below and the details on
each schedule type are provided in the following section.
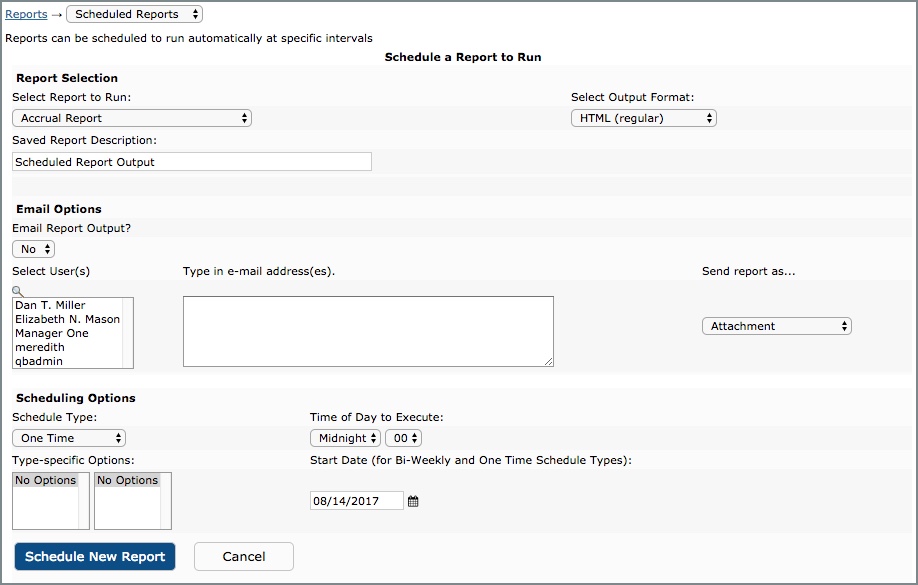
Figure 28.4. Scheduled Reports
To schedule a report, select the report you wish to schedule from the select list. Then select the output format of the scheduled report. Enter a description for the scheduled report.
In the next section, select email options if you would like to automatically email the report to users after it runs each time. You can select users who already have an email address in the Journyx system, or you can enter email addresses manually. The email recipients are not required to have Journyx accounts. If you choose the option to include an HTML report in the body of the email, please note that you should have your system email formatting set to HTML or Both (not Text only) under Configuration-->System Settings-->Server and Email.
In the next section, select the schedule type for the scheduled report. Select the Schedule Options for the scheduled report. Enter a start date for the scheduled report (One-Time Reports and Bi-Weekly Reports only). Enter a time of day for the scheduled report to run. Once you have completed these steps, click the Schedule New Report button. The system will refresh the Scheduled Reports Screen and display a green text message indicating that the report has been scheduled. Additionally, the newly Scheduled Report will be added to the list of existing Scheduled Reports located at the top of the Scheduled Reports Screen.
To modify an existing Scheduled Report, click the report you wish to modify from the list of existing Scheduled Reports. You will then be able to modify whichever options you wish to change for the Scheduled Report. Once you have completed these steps, click the Save button. The system will refresh the Scheduled Reports Screen and display a green text message indicating that the report has been modified.
To delete an existing Scheduled Report, simply select the report you wish to delete and click the Delete button. The system will display a warning asking you to confirm the deletion of the Scheduled Report.
Schedule Types
- One Time
A One Time report is a report that is run exactly once on a specific day at a specific time. The only settings required for a One Time report are the date and time at which you wish the report to run. When scheduling a One Time report, simply indicate the date of the report in the Start Date text box and select a time for the report to run on that date using the Run Time of Day select list.
- Daily
Daily reports are reports that are scheduled to run at a specific time on a daily basis. When scheduling a Daily report, you will need to select whether the report is to run every day or on weekdays only. Additionally, you will need to select a time for the report to run on that date using the Run Time of Day select list.
- Weekly
Weekly reports are reports that are scheduled to run once a week on a specific day of the week. Weekly reports may be set to run on one or more days of the week each week. When scheduling a Weekly report, you will need to indicate which day(s) you want the report to run by selecting the day(s) in the Schedule Options section. To select more than one day, ctrl-click or shift-click the individual days you want to select. Additionally, you will need to select a time for the report to run on that date using the Run Time of Day select list.
- Bi-Weekly
Bi-Weekly reports are reports that are scheduled to run every other week on a specific day of the week. Bi-Weekly reports may be set to run on one or more days of the week each week. When scheduling a Bi-Weekly report you will need to indicate which day(s) you want the report to run by selecting the day(s). To select more than one day, ctrl-click the individual days you want to select. You will also need to indicate a start date for the Bi-Weekly report. The start date for a Bi-Weekly report is used to determine the first day on which the report will be run. The report will not run on chosen days of the week that fall before the start date until the next bi-weekly cycle has begun. Finally, you will need to select a time for the report to run on that date using the Run Time of Day select list.
- Monthly by Day
Monthly by Day reports are reports that are scheduled to run on a specific 'soft' date such as 'the first Monday of the month' or 'the third Wednesday of the month'. To schedule a Monthly by Day report, you will need to select which 'period' of the month (1st, 2nd, 3rd, 4th, or 'last') you would like the report to target. You must then select the day of the week on which you would like the report to be run. Please note that you may select only one 'period' for any given report. You may, however, select any number of days within that 'period' for the report to be run. Therefore, you could schedule a report to run on the 3rd Monday and 3rd Thursday of each month with only one scheduled report. Finally, you will need to select a time for the report to run on that date using the Run Time of Day select list.
- Monthly by Date
Monthly by Date reports are reports that are scheduled to run on specific dates of each month such as 'the 3rd' or 'the 21st. Monthly by Date reports can be scheduled to occur on more than one date each month. To schedule a Monthly by Date report you will need to select the date(s) that you want the report to run by selecting the day(s). To select more than one date, ctrl-click or shift-click the individual days you want to select. Additionally, you will need to select a time for the report to run on that date using the Run Time of Day select list. The 'last' date of any month is truly the final day of that month. Journyx has been designed to understand that not all months have the same number of days. Therefore, you may schedule a report for the 'last' day of the month and Journyx will run the report on the 28th, 30th, 31st, etc. as deemed appropriate. Additionally, Journyx has been configured to apply the same understanding to reports that are scheduled for the 31st and 30th - these reports will be run on the last day of the month if the 30th or 31st is not relevant for that month.
- Monthly End
Monthly End reports are reports that are scheduled to run on a specific 'soft' date relative to the end of the month such as 'the first Weekday before the end of the month' or 'the fourth Day before the end of the month'. To schedule a Monthly End report, you will need to select which type of day (Day or Weekday) you would like the report to target. You must then select the number of days before the end of the month (1-14) on which you would like the report to be run. Please note that you may select only one 'type of day' for any given report. You may, however, select any number of day counts of that day type for the report to be run. Therefore, you could schedule a report to run 10 weekdays and 5 weekdays before the end of the month with only one scheduled report. Finally, you will need to select a time for the report to run on that date using the Run Time of Day select list.
System
Reports are located under Reports->System Reports (see figure 28.5). The system
incorporates the ability to run reports on individual aspects of your Journyx
configuration, allowing you to get a 'big picture' view of the information contained
within. With the System Reports, you can easily see which Users have access to
which Projects, which Activities are contained in which Groups, which Approvers are
associated with which Custom Approval Plans, and nearly any other combination
of internal data.
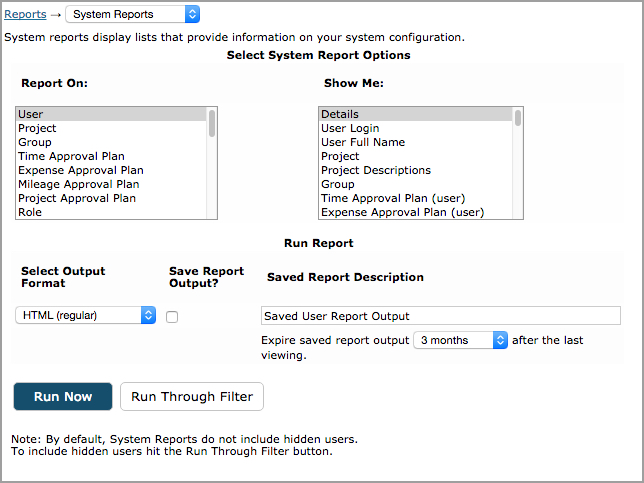
Figure 28.5. System Reports
Journyx's System Reports function provides a number of views of the information contained in the system database. To run a System Report you simply need to select the item on which you would like the report to be run and then indicate which associated items you would like to have shown in the report itself. The available items for reporting are the following:
Each reportable item has one or more associated items that can be selected for reporting purposes. You may select as many of these associated items as you choose from the Show Me list. You can use shift-click or ctrl-click functionality to select multiple items to show in the report. Once you have made your reporting selections, choose a report output format for the report. Before you run the System Report, you may choose to save the report output by checking the Save Report Output checkbox on this screen. If you intend to save the report output, you are encouraged to specify a more detailed Saved Report Description on this screen as well.
To run the System Report that you have designed, click the Run Now button. The system will open a new window containing the results of your System Report. You may close this window when you are finished. If you have chosen to run this System Report in the Plain Text (exported) format, you should print this report out before closing the window.
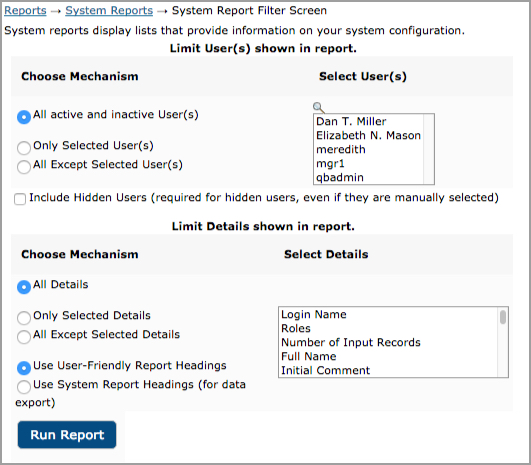
Filters and System ReportsYou can apply a limited set of filters to System Reports to provide even more filtered and detailed results. If you wish to run a System Report with a filter, select the criteria of your report as outlined above, including your desire to save the report output, and click the Run Through Filter button. Journyx will display the System Reports Filter Screen (see figure 28.6)
Figure 28.6. System Reports filters
This screen provides access to the tools needed to apply a filter to your System Report. System Report filters allow you to limit the scope of the report to show data in one of the following manners:
- All - Choosing the All option is equivalent to running the System Report without a filter at all.
- Only Selected - Choosing the Only Selected filter will constrain the report to show only data regarding the item(s) selected in the Selected column.
- All Except Selected - the All But Selected filter will constrain the report to show only data regarding the item(s) not selected in the Selected column.
You may select multiple items in the Selected column by ctrl-clicking or shift-clicking each item individually.
Once you have configured the System Report filter, click the Run Report Button. This will open a new window containing the results of your filtered System Report. You may close this window when you are finished. If you have chosen to run this System Report in the Plain Text (exported) format, you should print this report out before closing the window.
The product ships with a number of default reports
that should fit the needs of most users and organizations. However, Journyx
also includes a complete suite of report creation tools so that reports can be
customized (see figure 28.7).
Figure 28.7. Standard Reports
The first
thing you must choose when creating a new report in Journyx
is the Report Type
for the new report. Report Type defines the general functionality of the report
(see figure 28.8). This report parameter is described in detail below.
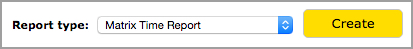
Figure 28.8. Report type selection
The system divides the default reports into four eight main categories:
Additionally, the system allows you to select between Time, Expense or Custom subtypes of Line Item Reports and Time or Expense subtypes of Matrix Reports. Each Report Type as well as the two/three subtypes have certain parameters that you may use to configure the reports. Each of these sets of parameters is discussed below.
Once the
report type has been selected, you will be directed to the Create Report screen
for that specific report type (see figure 28.9)
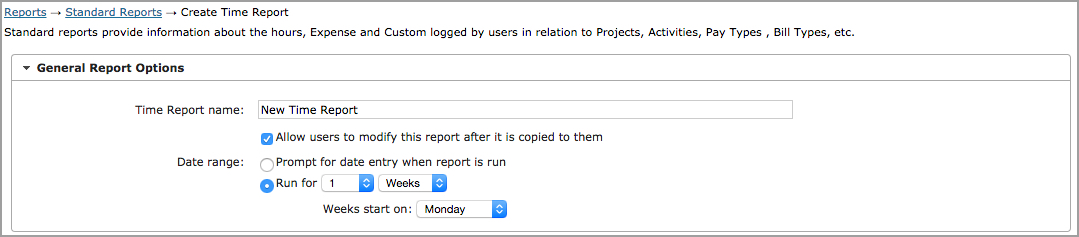
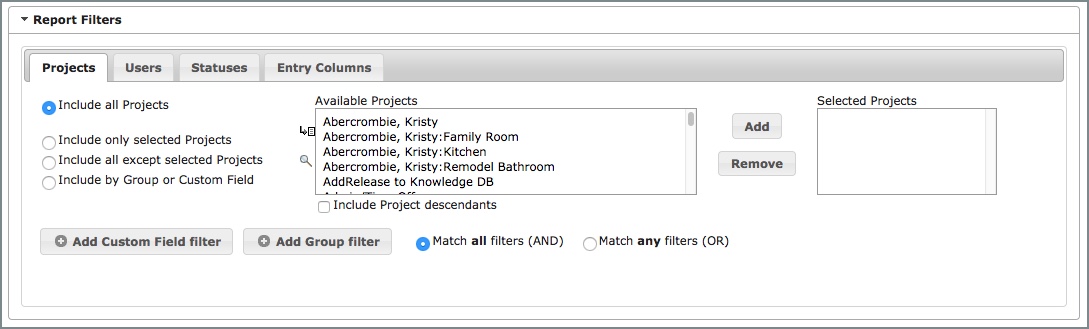
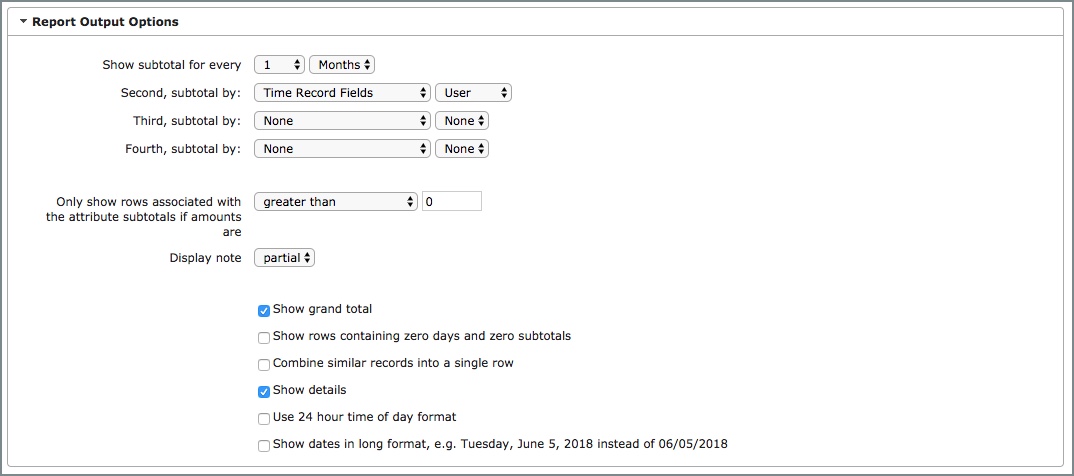
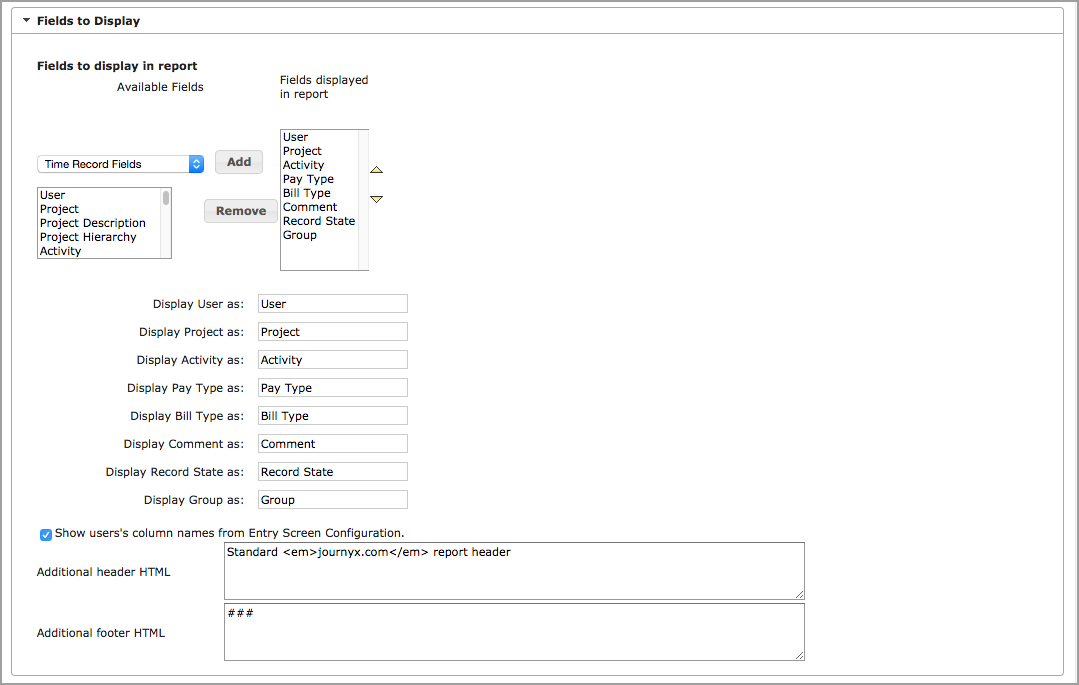
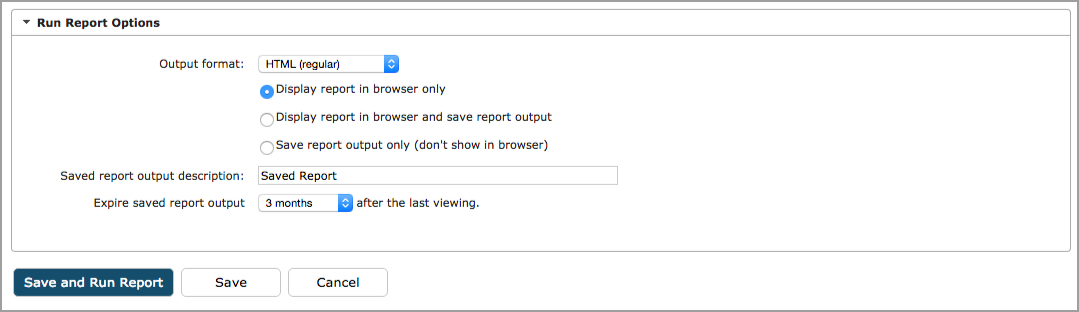
Figure 28.9. Report creation options
Line Item, Project Status, Scheduled Project Status, Assignment, and Profitability Reports share the same general report options. Each of these options is outlined below. NOTE: Scheduled Project Status and Profitability Reports have some special features related to the date range and report filters. The special features are covered in later sections specific to Scheduled Project Status and Profitability Reports.
User Modification of Reports
You are able to copy newly created reports to other users of the Journyx system. By default, all newly created reports that are assigned to other users can be edited by those users. When users modify their copy of a report, those changes are not reflected in any other copy of the report. If you are creating a report that you do not want other users to edit, this section allows you to indicate that choice. Simply change this option to 'No' and users who receive copies of this new report will not be able to make changes to the report. They will be able to view the report only as you have designed it. The copied report can still be modified by users with roles that are not limited to User Authority. Blocking modification of a copied report only applies to roles with User Authority.
Date Ranges for Reports
All reports in the system are designated as either reports that will request a date range or reports that will run on a specific dates. This portion of the report creation screen allows you to select which date range style you would like to use for your new report.
Reports that will request a date range will allow you to define the date range each time you run the report. When you run such a report, the system will ask you for the date range for the report to cover before returning data. Otherwise, the report will run for a specific range of time as defined from the date specification criteria. When you run such a report, the system returns data based on the period interval that has been defined for the report when the report was created. If you chose to create a report that will request a date range, you may then move on to the next step in report creation; however, if you choose to create a report to run on a particular interval, you must provide details on the date period before continuing to the next step. When creating such a report, you will need to choose a Length and Increment Type for the report. Report Lengths are a number between .25 and 365 as defined in the Length select list menu. Report Increments are standard time periods - day, week, month, and year. The output of such a report is based on the length/increment chosen at this point. Therefore, you could create a report that covers 90 days or one quarter (.25) year or nearly any combination of length/increment. Obviously, certain combinations of length/increment are more useful than others. After indicating the Length of the new report, you must also define a Start for the report. The Start tells the system exactly where the report should begin when returning data. The system requires either a 'day of the week or a combination of 'day of month' and a 'month of year' to function. A 'day of the week' must be selected for a report that has been configured with a length of one week or less. Reports that have been defined with a length of greater than one week must have a combination of 'day of month' and a 'month of year' established.
Report Filters
You are able to apply certain filters to newly created reports. These filters may be used to target the report output to specific Projects, Users, Record Status, and other Entry Column values (such as Activities, Pay Types, Bill Types, Expense Codes, etc.). Scheduled Project Status Reports are limited to filtering on scheduled projects. Assignment Reports are limited to filtering on users and scheduled projects. The process of using the report filters in the system is relatively straightforward. For each filter category, you may choose to have the system show the following range of each item:
- All - this option is equivalent to running the report without a filter on this item.
- Only Selected - this filter will constrain the report to show only data regarding the item(s) selected in the Selected column for this item.
- All Except Selected - this filter will constrain the report to show only data regarding the item(s) not selected in the Selected column for this item.
- Top Level Projects Only* - this filter is exclusive to Scheduled Project Status Reports and shows all projects one level under the system's "root" project in the project hierarchy.
You may select multiple items in the Selected column by using ctrl-click or shift-click functionality. Additionally, you may choose to show data associated with all of the selected projects' descendants by checking the 'Include Project Descendants' option at the bottom of the Project Filter section or you can choose to show or not show parent projects associated with selected tasks.
In addition to choosing the Project, User and Entry Column values to filter manually, you can also filter those values based on the custom fields associated with them. If your Projects, Users or Entry Columns have select list or multi-select type custom fields, these fields will show up as filter options in the filter table for each type of data. You can select the values for filtering a specific custom field. You can choose more than one value. Then you can determine if both values are required ("match all") or any one of them ("match any") will suffice for the filter. NOTE: Only select list and multi-select custom fields are available for filtering in reports.
In addition to entry field and custom field filters, you can also filter based on Journyx group membership. You can choose more than one value. Then you can determine if both values are required ("match all") or any one of them ("match any") will suffice for the filter.
The Status Filter works in the same manner as described above. The first pair of status filters relates to the Approval Status of records in relation to the standard Journyx sheet approvals. For more information on the standard sheet approvals process, please see the Approvals section of this manual. 'Approved/Committed' filters records that have been approved using the standard sheet approvals process. 'Not Approved/Not Committed' filters records that have not yet been approved using the standard sheet approvals process.
The second pair of status filters relates to the Synchronized Status of records in relation to transfer/export to third party systems. These filters only apply if Journyx Professional Services has provided you with an integration that transfers time, expenses or custom data to a third party system. 'Synchronized' filters records that have been exported to a third party system. 'Not Synchronized' filters records that have not yet been exported to a third party system.
The third pair of status filters relates to the Approval Status of records in relation to Project Approvals. For more information on the project approvals process, please see the Project Approvals section of this manual. 'Project Approved' filters records that have been approved using the Project Approvals process. 'Not Project Approved' filters records that have not been approved using the Project Approvals process.
The fourth pair of status filters related to records that are created in they system via the punch entry process. 'Created from Punch Records' filters records that have been created in the Journyx database from punch records. 'Not Created from Punch Records' filters records that have not yet been created in the Journyx database from punch records.
The Status Filter allows you to choose records that have multiple status types. You may choose any combination of filter items. When filtering by more than one pair of status filters, Journyx allows you to choose whether you want your results to be exclusive (OR) or inclusive (AND). Therefore, you can choose to have the report show items that are Synchronized OR Punch Records, or items that are both Period AND Project approved.
Fields to Display
Most report types include a section that allows you to choose which fields to display in the report. The types of fields available for display will vary by report type. To display a field in the report, select the field name on the left and click the Add button. The field name will move from the box on the left to the box on the right. You can use the arrows to next to the box on the right to change the display order of the fields in the report. To remove a field from the report, select the field name on the right and click the Remove button.
NOTE: The system will allow you to report on Custom Fields in addition to standard fields. Custom Fields labeled with an asterisk (*) are fields that have been enabled as Time, Expense or Custom Record Fields and will display their historical value - the value they had at the time of record creation - when shown in reports. Custom Fields that are not labeled with an asterisk are fields that have not been enabled for historical tracking and will display their current value - the value they have at the time that the report is run. For more information tracking custom field historical values, please see the Custom Fields portion of this manual.
Reports that provide a list of fields for display also allow you to rename these fields in the report output. As you select fields for inclusion in the report, additional lines will appear below the field selection where you can rename those fields for display in the selected report output. These fields will not be renamed elsewhere in the system.
Custom Column Names
"Show users's column names from Entry Screen Configuration": this checkbox lets you choose whether customized column names are shown in the report output. If this option is unchecked the report headers show the field/column names from System Settings -> Entry Screens. However if the option is checked then the field names shown reflect the users in the report, not necessarily the names used on the reporting user's own entry screens. The system determines which users are included in the report and shows all the column names relevant to those users. If a given column has more than one name then all the names are sorted in alphabetical order and separated by a / (slash) character. This option is not available for Scheduled Project Status and Assignment Reports.
Header and Footer
Journyx provides access to the header and footer text that appear on each Journyx report. These two areas accept plain text as well as HTML formatted text. Additionally, you may use one or more of the Journyx 'tricky tags' in these sections as well. Journyx 'tricky tags' are HTML-style tags that pull specific information directly from the Journyx database, such as the name of the User who is viewing the report, the name of the Time Entry Screen that is currently active for the viewing user, and similar data.
The available tricky tags are given below along with the system information that the 'tricky tag' will display. You must type the tag exactly as shown including capitalization.
Tricky Tag System Information Displayed <Login Name> Displays the login ID of the active user <Authorization> Specifically for use by the Journyx Professional Services team <Reserved> Specifically for use by the Journyx Professional Services team <Number of Input Records> Displays the number of blank rows that appear on this time entry screen for the active user; this number may be set globally for the Time Entry screen or may be left to the individual user to specify for himself <Number of Output Records> Specifically for use by the Journyx Professional Services team <Number of Dates> Displays the number of days contained in the time period upon which this time entry screen is based <Full Name> Displays the full User Name of the active user <Default Comment> Displays the default comment that the active user has defined under his preferences tab <Other Options> This tag is specifically for use by the Journyx Professional Services team <Expense Entry GUI in Use> Displays the name of the Expense Entry screen assigned to the active user <Time Entry GUI in Use> Displays the name of the Time Entry screen assigned to the active user <Domain ID> Displays the name of the Domain that contains the active user <Mileage Entry GUI in Use> Displays the name of the Custom Entry screen assigned to the active user <Custom Field Name> Displays the name of the contents of the named User Custom Field. For instance, if you want to show the contents of the user's custom field "Employee Number" then use the tag <Employee Number>. Likewise, in order to use the "Email Address" field you can use the tag <Email Address>. Please note that if you have renamed any of the default custom fields such as renaming "Email Address" to "E-mail" then you must use the renamed field name in the tag. If the user does not have a value set for that Custom Field then the tag will be replaced with a blank value. Any custom field with the same name as one of the standard tags mentioned above will be ignored. Any custom fields with Visibility set to Hidden will not show up. The user must also be assigned a role that is allowed to report on the custom field.
Expense and Custom Reports have a slightly different set of general options than those associated
with Time Reports and Project Reports. All of the general report options for expense and custom
reports are outlined below
(see figure 28.11).
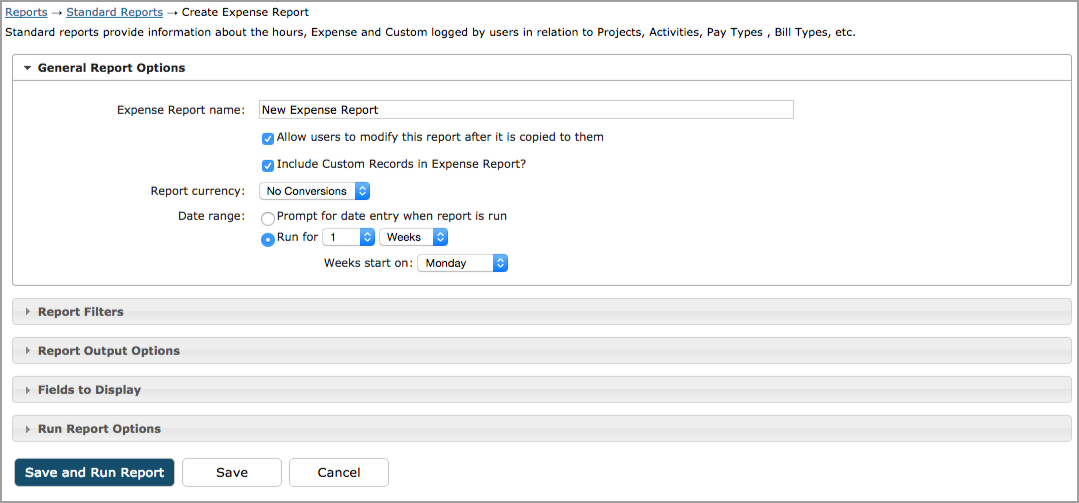
Figure 28.11. Expense Report
Include Custom Records in Expense Reports
If you are using a custom entry screen and would like to combine the custom entries with expenses for reporting, you can use this option to include the custom entry information in expense reports.
Currency Conversion
Journyx allows you to convert the expense values that will be shown in expense reports to another currency or custom values to a base currency based on your custom conversion rates. This section of the Report Modification screen allows you to select the currency to which these values will be converted. To establish a currency conversion for your new report, simply select the 'output currency' you wish the report to use from the select list box located in this section. Please note that you must have a previously established currency conversion and/or custom conversion in place for this setting to function properly. For more information on currency and custom conversions, please see the Conversions portion of this manual.
Along with the General Report Options discussed above, each new report in Journyx has a number of options that are associated with the type you have chosen for the report. The report types that are available are:
The options for the different report types are discussed below.
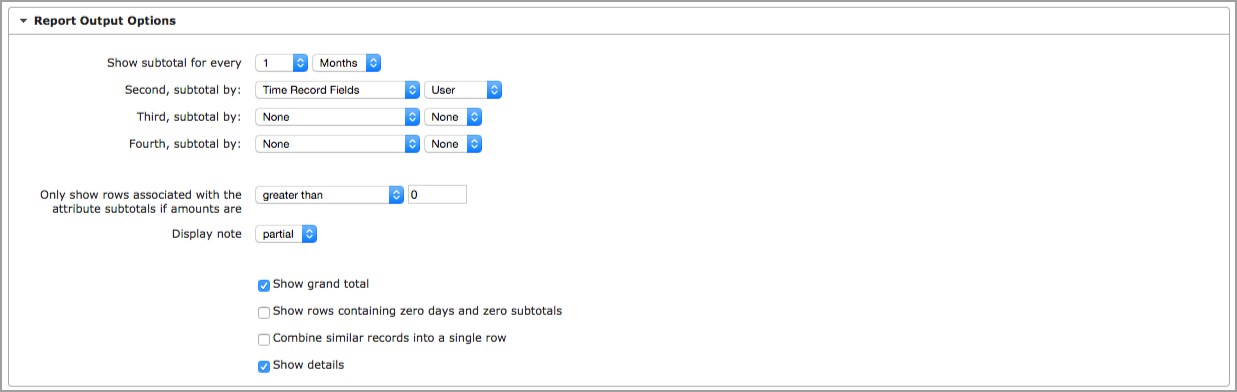
Figure 28.13. Line Item Options
Line Item reports provide you with the ability to show the details associated with the individual time, expense, and custom entries. The options specific to Line Item Reports are:
Subtotal Period
This option specifies the length and
period to use as the Subtotal Period for the report. The Subtotal Period determines
the timeframe that the system will use when calculating subtotals.
Within
Subtotal Period, Subtotal By Attribute
Use this option indicates which
item (User, Activity, etc.) to subtotal by.
Only Show Rows Associated With
Attribute Subtotal if Amounts Are
Use this option to limit the results
returned by the report. The report can be configured to show only records that
meet the rule you establish in this section. You may choose from greater than,
less than, and equal to the amount you enter in the text field.
Show
Grand Total?
This option will display a grand total of all subtotals
that are displayed in the report.
Show Zero Days and Zero Subtotals?
This option determines whether the report will display subtotals that equal '0'
in value.
Show Details?
This option will display the selected
fields below in the report output.
Combine Similar Records into a Single
Row?
This option will combine all records that are identical in terms
of Project, Activity, Pay Type, Bill Type, and comments into one record in this report,
thereby simplifying the view. This is used to combine corrective records created
when a sheet is rejected and modified through an approval process. Otherwise,
the system will display all records individually.
Fields to Display
Line Item reports include the option to display all of the details associated with time,
expenses and custom entries. Included in these details is the ability to report on attachments.
When the attachments field is included in the field list for display in a report, any entry with
an attachment will include a link to view the attachment on the line for the entry. In addition
to the links for viewing attachments, you also have the option to view all of the attachments
included in a report by clicking on the Show Attachments button at the foot of the report. When
you click on the Show Attachments button, all attachments are shown below the report. NOTE: When
printing a report with attachments shown below the report, you must print PDF attachments
separately. The Print PDFs button is next to the Show Attachments button at the foot of the
report. It will allow you to print all PDFs in the report in one print job.
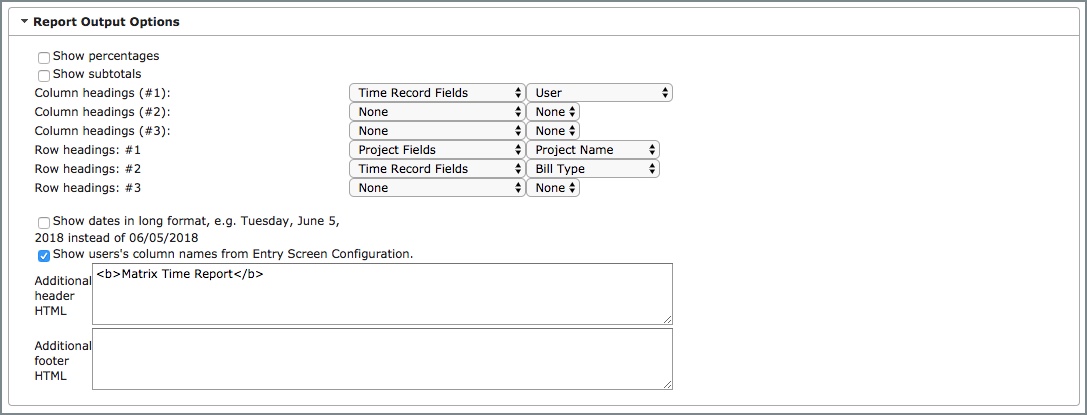
Figure 28.14. Matrix Report options
Matrix reports provide a cross-reference style report that resembles a matrix.
The options specific to Matrix Reports are:
Show Percentages
This
option will calculate the percentages of the grand total that each subtotal item
represents and display those percentages in the report.
Show Subtotals
This option will calculate and display subtotals for each category in the report
output.
Column Headings
Choose one item
from this select list to serve as the column header. This value combined with
the Row Header option will be the matrix.
Row Headings
Choose one item from this select list to serve as the row header. This value
combined with the Column Heading option will be the matrix.
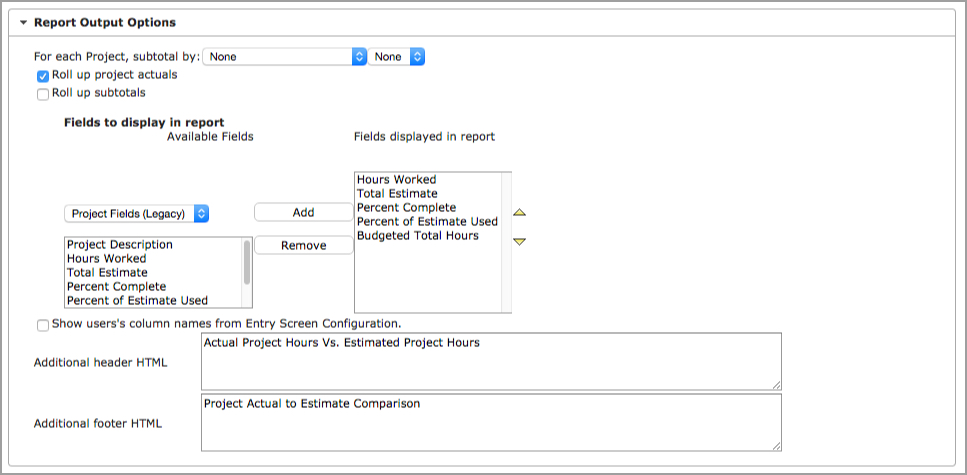
Figure 28.15. Project Status Report Options
Project Status Reports provide project status overviews with data rolled up from tasks to the project level.
The options specific to Project Status Reports are:
Roll up project estimates and actuals
This option will add the hours logged to each subproject/task to the total hours
logged to that subproject's parent project and do the same for estimated hours.
For each Project, subtotal
by:
You may use this section to choose the category you would
like Journyx to use for subtotaling in this report.
Roll up subtotals
This option will add the subtotal of the hours logged to each subproject/task to the
subtotal of hours logged to that subproject's parent project.
You can create Total Cost Reports which show the
total cost of a project or user by combining time, expense, and custom entry data in
a single report. Total Cost Reports can be created on the Standard Reports screen,
which is accessed via the Reports menu.
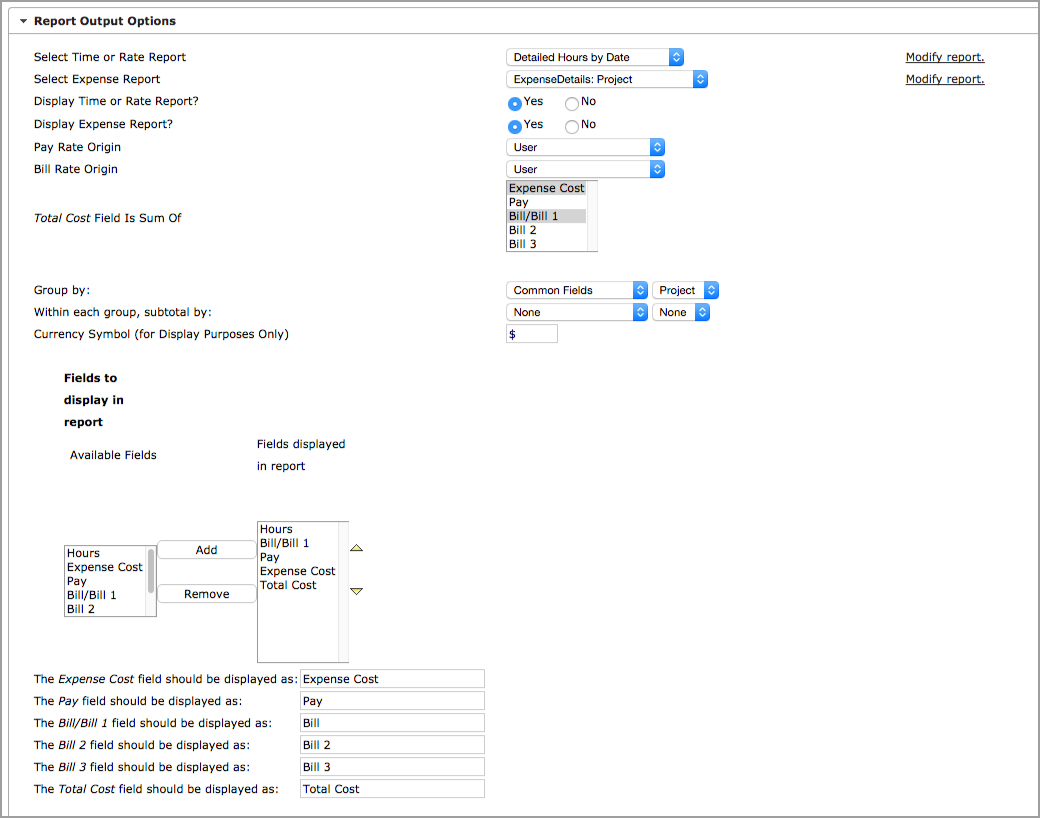
Figure 28.16. Total Cost Report
Total Cost Reports are built from the data contained in two base reports - a Time or Rate Report and an Expense Report. This section of the Report Modification screen allows you to specify which of these reports Journyx will use when gathering the data used to create this Total Cost Report.
Use the select list menus in this section to select the base reports to be used as the basis of this Total Cost Report. The 'Select Time or Rate Report' select list separates Time Reports and Rate Reports into two separate groups for easy identification. If you do not have any Rate Reports set up in Journyx, only Time Reports will be displayed in this select list. Additionally, only Journyx Administrators will see the default Approval and Preview reports.
To make changes to the base Time or Rate Report and/or Expense Report, click the 'Click here to modify selected report' link located just below the select list for each option. Journyx will open the Report Modification screen for the base reports in a new window. This will allow you to tailor the data contained in the base report in question, and thereby control what data is shown in this Total Cost Report.
Show Or Hide Base Reports
Journyx can be configured to display or hide the base reports for this Total Cost Report on the output screen. Simply select 'yes' or 'no' for both the Time or Rate Report and the Expense Report that are serving as the base reports and Journyx will either display or hide those reports.Pay And Bill Rate Origins
Total Cost Reports calculate values for payroll, project costs and billing by multiplying the employee hours worked by the pay and bill rates in Journyx. Projects, users, project-activity combinations and assignments can have pay and bill rates, and these options allow you to specify which rates should be used in this particular Total Cost Report. The possible choices are:
- User
Journyx will use the user's pay or bill rate. If the user has no pay or bill rate Journyx will not calculate a value for the user in question and will display a dash (-) for that user's records.
- Project
Journyx will use the pay and bill rates associated with the project in question. If the project has no pay or bill rate Journyx will not calculate a value for the project in question and will display a dash (-) for records associated with that project.
- Greater
Journyx will use the greater rate value regardless of whether it is associated with the user or the project. This setting does not include project-activity or assignment rates.
- Lesser
Journyx will use the lesser rate value regardless of whether it is associated with the user or the project. This setting does not include project-activity or assignment rates.
- Prefer User
Journyx will attempt to use the user's rate value for calculations; however, if the user has no rate value Journyx will look to the project in question and use the value associated with it rather than produce a (-) result by default.
- Prefer Project
Journyx will attempt to use the project's rate value for calculations; however, if the project has no rate value Journyx will look to the user in question and use the value associated with it rather than produce a (-) result by default.
- Derived From Rate Report
Journyx will use rate values derived from the Rate Report that has been specified as one of the base reports for this Total Cost Report. This option will only be accepted by Journyx if you have selected a Rate Report as one of the base reports for this Total Cost Report. Otherwise, you will be asked to select a different option.
- Project-Activity Rates
Journyx will use the project-activity combination pay or bill rate. If the project and activity in the time record has no pay or bill rate Journyx will not calculate a value for the record in question and will display a dash (-) for that record.
- Assignment
Journyx will use the assignment pay or bill rate. If the assignment associated with the time record has no pay or bill rate Journyx will not calculate a value for the record in question and will display a dash (-) for that record.
Total Cost Is A Sum Of?
This option allows you to specify which values are added together to determine the total cost for each project or user shown in this Total Cost Report. By default, the total cost is defined as the sum of the value of the Bill/Bill 1 fields and the Expenses field. You may also include the Payroll field and the Bill 2 and Bill 3 fields associated with a Rate Report if that Rate Report is chosen as one of the base reports for this Total Cost Report.
Groups Records By
This option allows you to specify whether the records contained in this Total Cost Report should be grouped by project or by user. The grouping method you choose here will allow you to see the total cost associated with either the project as a whole or on an individual user basis.
Subtotal By
You may or may not choose to display subtotals in this Total Cost Report. If you choose to show subtotals, you should choose the 'other' value from the previous option. For example, if you are designing a Total Cost Report that will group by Project and you would like to include subtotals, you should choose subtotal by User for this option.
Currency Symbol
This option allows you to specify a currency symbol that will be used in this report only - this setting will not affect currency conversions, for this or any other report or function. You may include typed/pasted ASCII characters ($, €, etc.) as well as HTML entities (€ for €, ¥ for ¥, etc.) or even just the standard three-character abbreviation (EUR, YEN, USD, etc.) for the currency represented by the values in this report. Regardless of which method you use, this field may contain a maximum of 6 characters.NOTE: Currency symbols entered as HTML entities will appear as they are typed (i.e., €) in plain text versions of this report. Therefore Journyx recommends pasting ASCII characters or using three-letter abbreviations for the currency symbol for Total Cost Reports.
Fields to Display in Report
This option allows you to specify which of the Total Cost Report fields should be displayed in the current report. The fields specific to the Total Cost Report are: (defaults in italics)
- Hours
- Expense Cost
- Pay
- Bill/Bill1
- Bill 2
- Bill 3
- Total Cost
You can create Profitability Reports which show cost, revenue and profit per project by combining
project estimates with actual time, expense, and custom entry data in a single report.
Profitability Reports can be created on the Standard Reports screen, which is accessed via the
Reports menu.
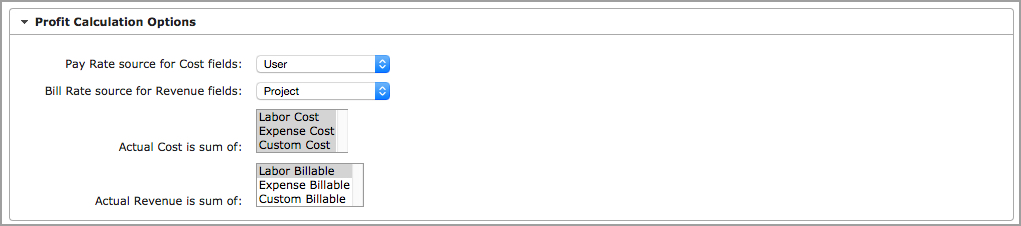
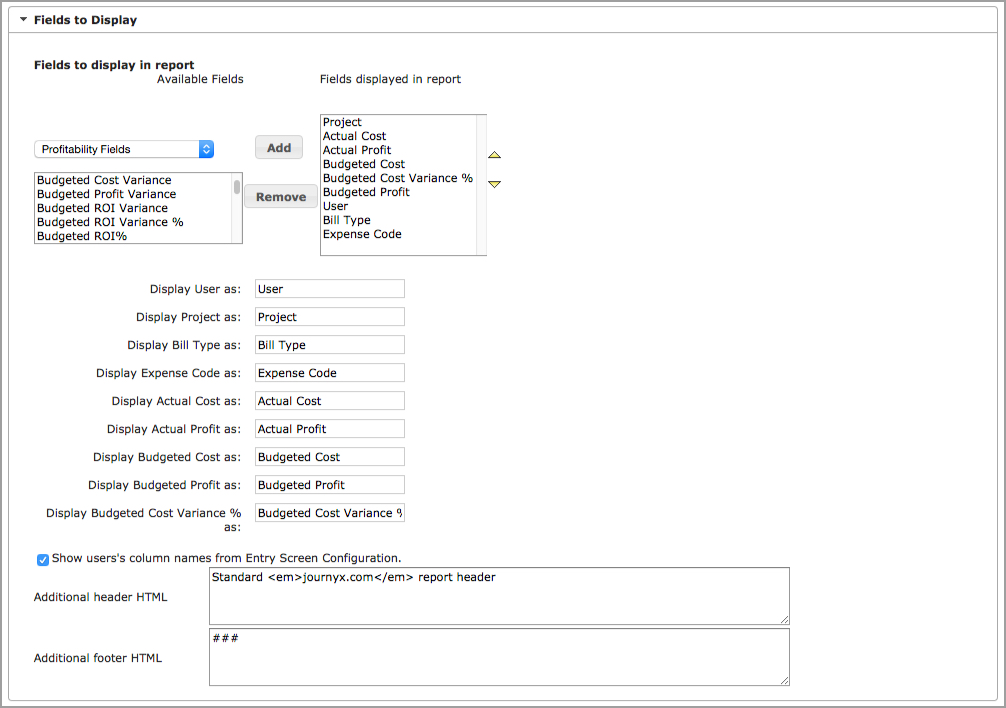
Figure 28.22. Profitability Report
Profitability Reports provide calculated fields for reporting on project costs, revenues, profits and ROI. Then main report output shows project financials, along with other selected data specific to the project. In addition to the project summaries, the Profitability Report includes the ability to drill down into the details of the time, expense and custom data that is used to calculate the project financials. So long as a project has hours/expenses logged against it, you can click on the project name to expand or collapse the detailed report that contains a list of the individual records.
The date range options for Profitability Reports are the same as those offered in other report types. However, the way they are used to filter data is somewhat different. In most report types, the dates determine what actual hours or expenses are shown in the report. For Profitability Reports, the dates are used to filter on active projects for the date range. In other words, all projects with start or end dates that fall within the report date range are shown in the report, regardless of whether or not actuals were entered during the period. If you are not entering start and end dates for your individual projects (or scheduled start and end dates for scheduled projects in Journyx), you may override the date range for the report under the Report Filters section. If you are using Journyx Projectlink to import any of your projects from MS Project, you will need to use the MSP Start and End Date fields to store dates for your unscheduled projects.
You are only allowed to override the report date range if you select some project filters for the report first. Otherwise, you may have difficulty running the report if you are trying to include every project in your system. Journyx recommends either limiting the report date range or the project list in order to ensure the report will run in a reasonable amount of time. This report is not only running calculations for project financials, but it is also rolling up totals from task, to summary task, to project.
There are a few project filtering options that are unique to Profitability Reports. Under Report Filters, the Profitability Report includes most of the same options available for other report types. The option to disable the report date range when project filters are in place was discussed above. Another project filter option unique to the Profitability Report is the Project Type filter. This filter is only needed if you are using Journyx. In Journyx, you can choose to limit the report to scheduled projects, unscheduled projects or include both. The last option for report filtering can be found under Report Output Options, and it allows you to limit your list of projects to a specific level of the project hierarchy (e.g., level 1 is any project directly under the "root" or top level project).
Additional options specific to Profitability Reports under Profit Calculation Options are:
Pay Rate source for Cost fields
Profitability Reports include project cost fields that multiply the user hours worked by a
specific pay rate in the Journyx system. This option allows you to choose the pay rate source
for the cost calculations in this report. The choices for rate source are:
NOTE: Project-Activity rates cannot be used for "projected" field calculations because they require actual selections as the time is entered. Projected fields are available for Journyx only.
Bill Rate source for Revenue fields
Profitability Reports include project revenue fields that multiply the user hours worked by a
specific bill rate in the Journyx system. This option allows you to choose the bill rate source
for the revenue calculations in this report. The choices for rate source are:
NOTE: Project-Activity rates cannot be used for "projected" field calculations because they require actual selections as the time is entered. Projected fields are available for Journyx only.
Actual Cost is sum of
This option allows you to choose what data will be included in the Actual Cost field for this
report. You can limit it to your time/labor data, or you can include expense and other custom
types of data as well.
Actual Revenue is sum of
This option allows you to choose what data will be included in the Actual Revenue field for this
report. You can limit it to your time/labor data, or you can include expense and other custom
types of data as well.
Additional options specific to Profitability Reports under Fields to Display are:
Actual Fields
The "actual" fields include Actual Cost, Actual Revenue, Actual Profit
and Actual ROI%. Actual Cost and Actual Revenue are calculated based on your selections in the
Profit Calculations Options section of this report. Actual Profit is Actual Revenue minus Actual
Cost. Actual ROI% is Actual Profit divided by Actual Cost.
Budgeted Fields
The "budgeted" fields include Budgeted Cost, Budgeted Revenue, Budgeted
Profit, Budgeted ROI% and Budgeted Work Hours. All of the budgeted fields also have variance and
variance % calculations for comparison to their respective actual fields. For example, Budgeted
Cost Variance is Budgeted Cost minus Actual Cost. You can also view the variance amount as a
percentage. Budgeted fields must be filled in manually for each project. You can fill them in at
the project level, or you can fill them in at the task level and roll the amounts up to the
project.
NOTE: Budgeted Work Hours comes from the Estimated Hours field for Journyx (unscheduled) projects. Like the other budgeted amounts, you can estimate your hours at the project level or roll it up from the individual tasks. If you are using Journyx, Budgeted Work Hours is calculated based on the scheduled work for your assignments.
Projected Fields
The "projected" fields are only available in Journyx and include
Projected Cost, Projected Revenue, Projected Profit and Projected ROI%. All of the projected
fields also have variance and variance % calculations for comparison to their respective actual
fields. For example, Projected Cost Variance is Projected Cost minus Actual Cost. You can also
view the variance amount as a percentage. Projected Cost and Projected Revenue use the rate
selections under the Profit Calculations Options section of this report to multiply pay and bill
rates by the amount of scheduled work assigned to a project or task. Projected Profit is
Projected Revenue minus Projected Cost. Projected ROI% is Projected Profit divided by Projected
Cost.
You can create Accrual Reports which show current user accrual balances, time taken and events
that caused balances to change over a selected period in a single report. Accrual Reports can be
created on the Standard Reports screen, which is accessed via the Reports menu.
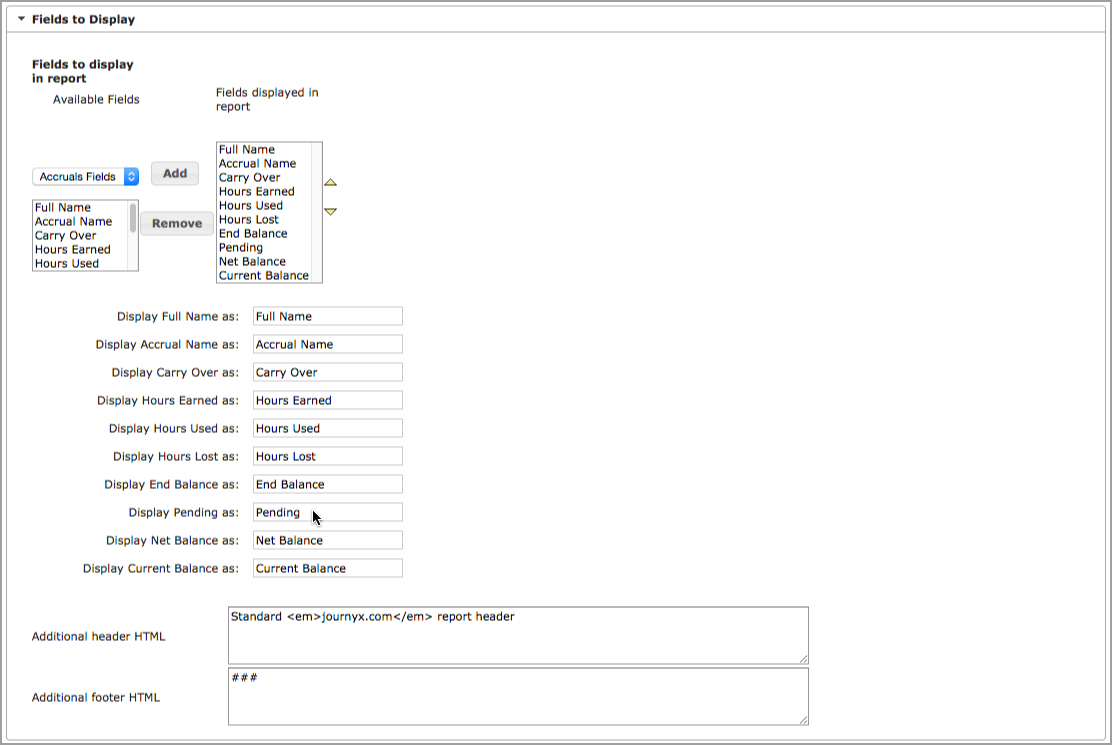
Figure 28.23. Accrual Report
Accrual Reports provide current accrual balance amounts, along with summary and detailed information on what changed the balances during the reporting period. The main report output shows carry over amounts, hours earned, hours lost, hours used, pending leave time and current accrual balances. In addition to the summary information, the Accrual Report includes the ability to drill down into the details of each accrual to see what events caused the balance to change during the reporting period. You can click on the accrual name to expand or collapse the detailed report that contains a detailed change event list.
The date range options for Accrual Reports are the same as those offered in other standard report types. The date range determines the accrual balance activity that will appear in the report.
Filtering is available for users and pay types. The filters include the same options as other standard reports.
Additional options specific to Accrual Reports under Report Output Options are:
Include details about each accrual
When this setting is enabled, each accrual for a user will be shown individually with
corresponding totals. If this setting is disabled, the report will show one total per user that
sums all of the user's various accruals.
Include detailed accrual history as sub-reports
In addition to the basic fields that can be displayed in the main section of Accrual Reports,
you can also include a detailed event history for each accrual. The details are accessed in a
sub-report that can be expanded or collapsed by clicking on the accrual name.
Include Holidays in Pending time
This option allows you to show how holiday time scheduled in the future will affect accrual
balances. This option should only be used if you track your holiday time against an accrual
balance.
Additional options specific to Accrual Reports under Fields to Display are:
Accrual Name
This field displays the name used to set up each accrual balance for a
user.
Carry Over
This field displays the accrual balance carried over from the previous
reporting period or the starting balance from accrual history events.
Hours Earned
This field shows any accrual balance hours that were gained during the
reporting period.
Hours Used
This field shows all of the time taken against an accrual balance during the
reporting period.
Hours Lost
This field shows any accrual balance hours that were lost during the
reporting period.
End Balance
This field shows the ending accrual balance for the reporting period, not
including any deductions for pending leave and/or holiday time.
Pending
This field shows all pending leave requests that are scheduled, but have not
yet been taken, during the reporting period. If you have enabled the option to include holidays,
this field will also include holiday time scheduled, but not yet taken.
Net Balance
This field shows the ending accrual balance for the reporting period,
including deductions for pending leave and/or holiday time.
Current Balance
This field displays the current balance of an accrual based on the
current date. The date range of the report has no impact on this amount. The amount does not
include deductions for pending leave and/or holiday time.
You can create User Compliance Reports which show the completion and submission status of user
timesheets, as well as expense and custom entry, for a given period. User Compliance Reports can
be created on the Standard Reports screen, which is accessed via the Reports menu.
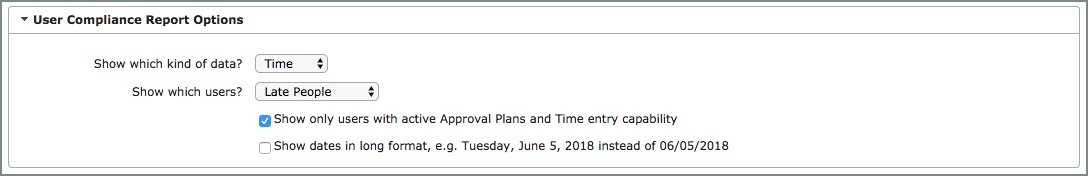
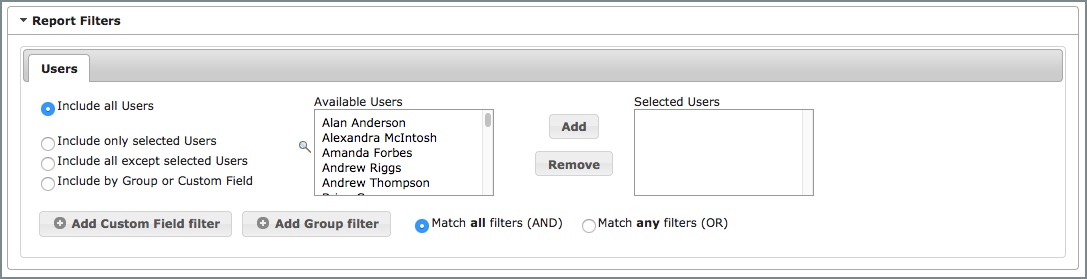
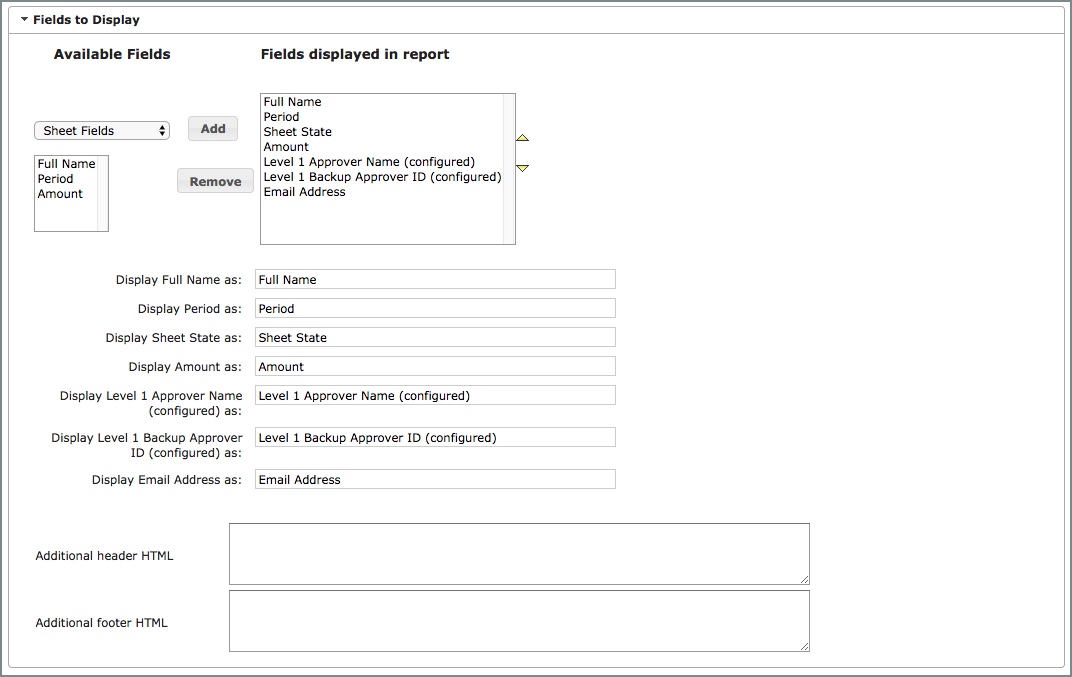
Figure 28.24. User Compliance Report
User Compliance Reports provide reporting on sheet status based on the user. The report provides an option to filter based on users who are late submitting timesheets for a period.
The date range options for User Compliance Reports are the same as those offered in other standard report types. The date range determines the sheets that will appear in the report.
Filtering is available for users. The filters include the same options as other standard reports.
Billable Forecast Reports calculate billable hours and revenue for future months. The reports use the User Bill Rate custom field and future assignment schedules to determine approximate expected monthly billings in the future. The calculations work for both Time and Materials (T&M) and Fixed Price (FP) projects.
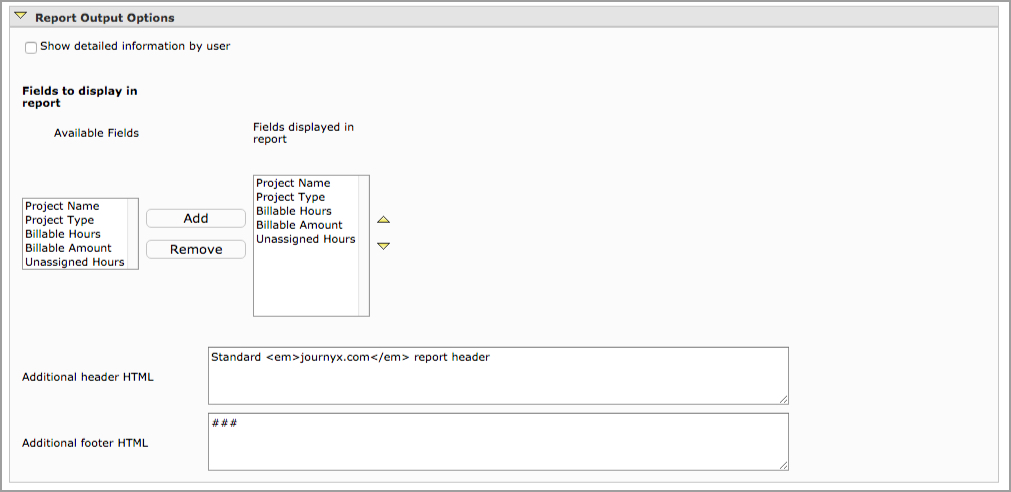
Figure 28.20. Billable Forecast Report options
Billable Forecast Reports have some prerequisites for displaying accurate data. The
prerequisites are as follows:
The date range options for Billable Forecast Reports are the same as those offered in other report types. However, the way they are used to filter data is somewhat different. In most report types, the dates determine what actual hours or expenses are shown in the report. For Billable Forecast Reports, the dates are used to filter on active scheduled projects for the date range. In other words, all scheduled projects with scheduled start or end dates that fall within the report date range are shown in the report, regardless of whether or not actuals were entered during the period. Setting Billable Forecast Reports to ask for the date at run time generally makes the most sense because these reports will be run for a future period most of the time.
Show detailed information by user
This option breaks down each task and project
into
the Monthly Billable Hours and Amounts per user. The user details are listed under each task
and/or project.
Fields to Display in Report
This option allows you to specify which of the
Billable Forecast Report fields should be displayed in the current report. The
fields specific to the Billable Forecast Report are:
Billable Hours
This field shows the total remaining scheduled hours forecasted for billable projects based on the date range selected and broken out by month. Since this is a future/forecast report, there should be no actual hours to consider, but they will be ignored if entered. The scheduled hours are calculated based on the task assignments for a project.Billable Amount
There are two separate calculations that are performed to establish the total estimated billing for any month, one for Time & Material project and one for Fixed Price projects. The Fixed Price calculation determines Earned Services Revenue (ESR), which is defined as (services % complete * services contract value). The Time & Material calculation determines Billed Services Revenue (BSR), which is defined as (projected user hours * user bill rate). For this report, both types of projects are shown on a monthly basis for all users and then aggregated to give the monthly total.Unassigned Hours
This field shows the number of task scheduled hours that are still unassigned broken out by month. These scheduled hours are not included in the Billable Amounts because there are no users assigned to work these hours.
Utilization/Chargeability Reports calculate utilization and billing rates for evaluation against target rates.
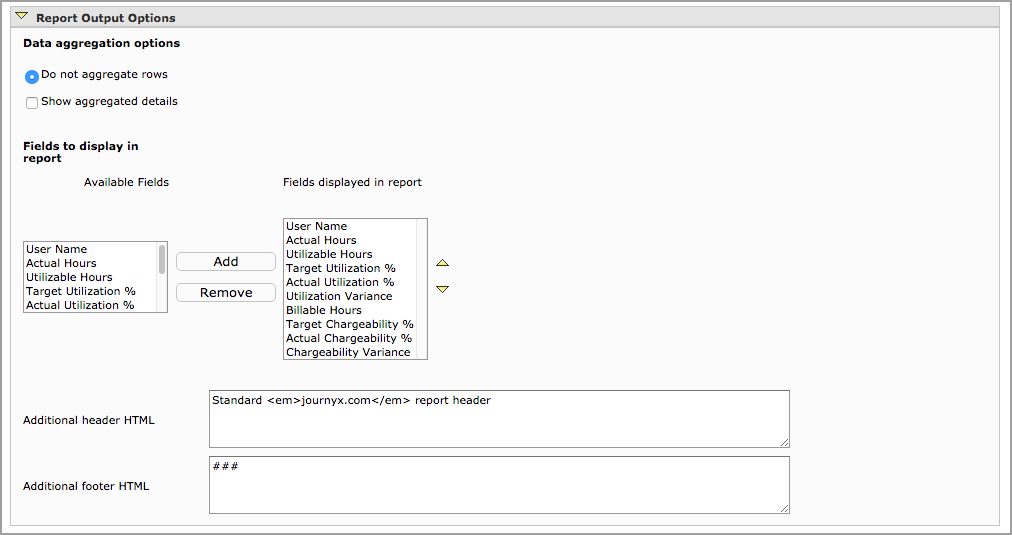
Figure 28.21 Utilization/Chargeability Report options
Utilization/Chargeability Reports have some prerequisites for displaying accurate data.
The
prerequisites are as follows:
Show aggregated details
This option allows you to aggregate utilization or
chargeability rates for multiple users.
Fields to Display in Report
This option allows you to specify which of the
Utilization/Chargeability Report fields should be displayed in the current report. The
fields specific to the Utilization/Chargeability Report are:
Actual Hours
This field displays the actual hours the user worked for the selected period.Target Utilization %
This field displays the value in the user’s Target Utilization field.Actual Utilization %
This field is a calculation of total hours logged against tasks that are flagged 'Yes' in the Utilization Eligible custom project field for the selected dates ÷ (user work hours per day X number of working days between dates). The user work hours per day is derived from the user custom field called "User Work Hours Per Week". If an individual user does not have a value set for this field, the user will be assigned to the default value set under Configuration-->System Settings-->Project Settings in the field called "Default number of hours worked each week". The calculation assumes that weekdays are working days, and there are 5 working days each week.Utilization Variance
This field subtracts target utilization from actual utilization.Billable Hours
This field displays the actual hours the user worked for the selected period that are eligible for billing based on the Project Bill Type field.Target Chargeability %
This field displays the value in the user’s Target Chargeability field.Actual Chargeability %
This field is a calculation of total hours logged against tasks that are 'Billable' for selected dates ÷ ((user work hours per week x (report end date - report start date)) ÷ 7 days.Chargeability Variance
This field subtracts target chargeability from actual chargeability.
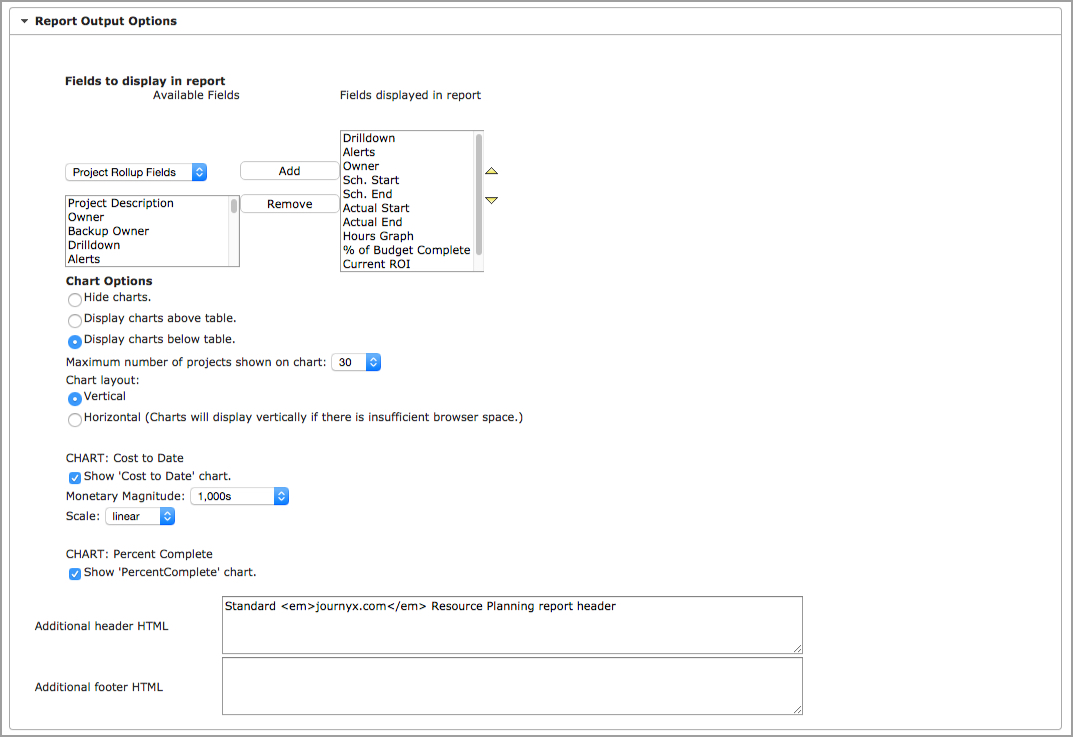
Figure 28.15.1. Scheduled Project Status Report options
Scheduled Project Status Reports provide dashboard report overviews, as well as detailed project status reporting options for scheduled projects.
NOTE: The information in the Scheduled Project Status report is dependent on what is referred to as "rollup data". The rollup data ensures that any changes made to assignments (e.g., actual work logged, scheduled work or date changes) roll up to the task, summary task and project levels. Journyx includes a rollup data process that runs every 15-20 minutes that updates the Scheduled Project Status report information to include the most recent changes. As a result, you may not see changes made to the scheduled project information if they were made less than 20 minutes before you run the report.
The date range options for Scheduled Project Status Reports are the same as those offered in other report types. However, the way they are used to filter data is somewhat different. In most report types, the dates determine what actual hours or expenses are shown in the report. For Scheduled Project Status Reports, the dates are used to filter on active scheduled projects for the date range. In other words, all scheduled projects with scheduled start or end dates that fall within the report date range are shown in the report, regardless of whether or not actuals were entered during the period.
Fields to Display in Report
This option allows you to specify which of the
Scheduled Project Status Report fields should be displayed in the current report. Most of
the
fields match the names of scheduled project fields, but the Scheduled Project Status Report
also
includes information specifically for this report:
Hours Graph
Scheduled Project Status Reports include a graphical field that is
unique to this type of report called the Hours Graph. The Hours Graph includes two bar
graphs with segment dividers that represent various project data. The top bar shows total
actual hours in relation to the total scheduled hours. The bottom bar shows total assigned
hours in relation to the total scheduled hours. Both bars include a mark for the current day
in order to compare where planning and actual work should be on a given day based on the
calendar schedule. The bar graphs are also divided into uneven segments based on the amount
of scheduled work in each calendar period. Lastly, the bar graphs include detailed mouse
over information that provides the numeric data included in the graphs.
Chart Options
Scheduled Project Status Reports include two types of charts that
may be included with the report screen output. The charts show project cost to date and
project
schedule status, respectively.There are options to hide/show one or both charts, and you can
choose to display them above or below the text output. You can also choose to chose them
side by
side (horizontally) or on top of one another (vertically), and you can limit the number of
projects to ensure the chart is legible. For the cost to date chart you can choose the
scale:
linear, percent or log. Your choice will depend on how much the amounts vary amongst the
projects that are displayed. If the variance is small, you can choose linear along with the
monetary magnitude that applies to your projects. If the variance is large, you could choose
percent or log. If it is very early in the life of a large/costly project and costs are
still
very low as a percentage, the log option will provide the most useful view of the
information.
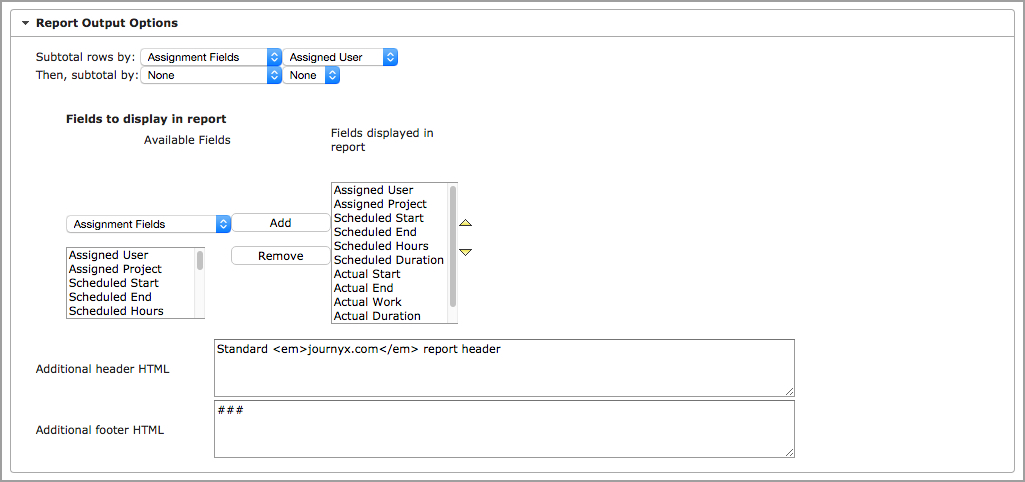
Figure 28.15.2. Assignment Report options
Assignment Reports provide detailed information on current and future assignments. The
lists
of assignments can be organized by project or by user.
The options specific to Assignment Reports are:
Subtotal Options
Assignment Reports include two subtotal options. The first row
sets
the primary subtotal option, and the second row subtotals within the primary subtotal.
Subtotaling is optional. To include a subtotal, select the type of field from the first
select
list menu. Then select the specific field for subtotaling from the second menu. You can use
the
assignment fields to subtotal by user or task. The project filters allow you to limit data
in
the report to specific projects.
At the bottom of the Report Modification screen, Journyx provides access to tools needed to save the new report. You may also choose to save and run your new report to see how the report output looks on-screen by clicking the Save and Run Report button. You may run your new report in any of the report output formats discussed above in the Running a Report section.
To modify any existing report, simply select the report you wish to change from the list of available reports on the Main Report Menu by clicking on the report name. Journyx will display the Report Modification Screen, with all of the current settings for the report in question already in place. You may modify these settings as desired. For information on each of the report options displayed on the Report Modification Screen please see the Creating a New Report section above.
Journyx allows you to copy existing reports to other users. You can also use this functionality to create a 'backup' copy of one of your existing reports before you make changes to it. The process for copying a report, both to yourself and to other users, is outlined below. Select the report you wish to copy from the list of existing reports on the Main Report Menu. Click the Copy button. Journyx will display the Report Copying screen.
Select the users you would like to copy the report to. You can use the ctrl-click or shift-clk functionality to select multiple users. You may click your own user name to copy this report to yourself. Enter a name for the copied report. Indicate whether or not the new report overwrites existing reports with the same name. In general, you should not tell Journyx to overwrite existing report. This option is generally only used by Journyx Administrators when a change is needed system-wide in a standard report. Click the Copy Report button.
Journyx will display the Main Report Menu, including a green text message indicating that the report has been copied to the users you selected. The selected users will now see the report you have copied to them in their list of available reports.
Reports in Journyx can be removed on an individual user basis - that is, each user can remove reports for him or herself only. All of a user's available reports can be removed, including the default reports that ship with Journyx. To remove a report, simply select the report to remove from the list of available reports and click the Delete button. Journyx will display a popup warning window asking you to confirm that you do indeed wish to delete the selected report. If you wish to continue, click the OK button in the popup window. Journyx will refresh the Main Report Menu and display a green text message confirming the deletion of the selected report. Additionally, the deleted report will no longer be listed in the available reports list.
Information for downloading and using Journyx Reportlink is located under Reports-->Reportlink Exchange. This screen includes access to the most up-to-date version of the Reportlink installer, as well as the Reportlink User Manual (available when downloading the installer). Reportlink is an optional , MS Excel-based reporting engine, and you must have a license key for access to the installer. Reportlink includes a variety of data feeds that can be loaded into pivot tables or spreadsheets. It also includes the ability to run your Standard and System reports as pivot reports in Excel. More information is available in the Reportlink User Manual.