Resource Availability is located under Management-->Scheduled Projects-->Resource
Availability
Resource Availability allows you to review user schedules for a selected period and compare users
based on available time. Resource Availability includes a date range selection option, user
search and user search results with bar graphs showing scheduled time using various blocks of
color to represent types of scheduled time (see figures 37.1).
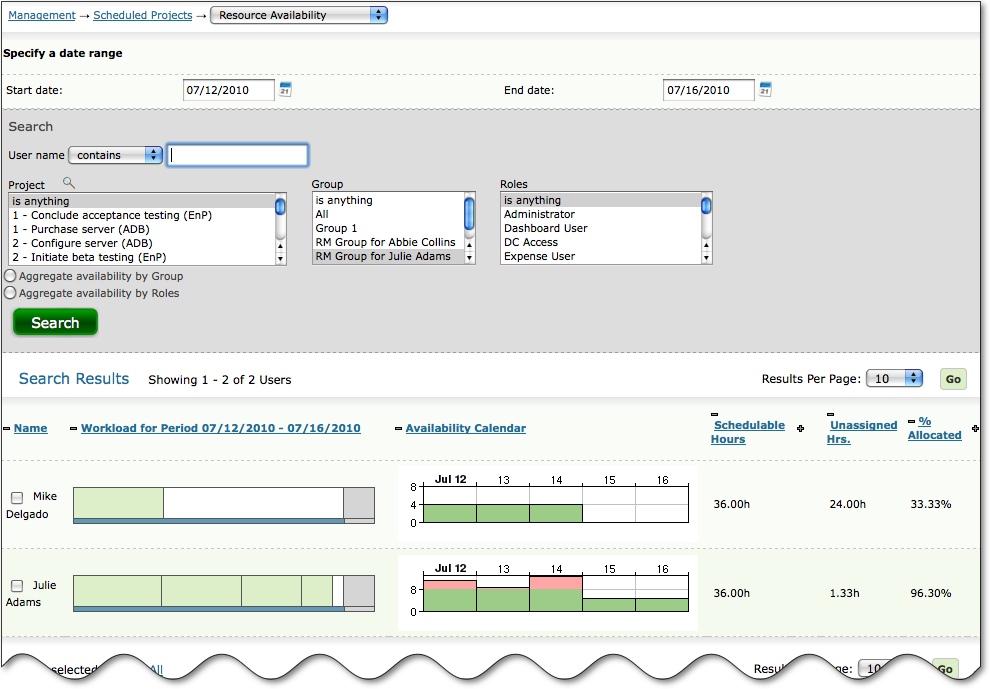
Figure 37.1.Resource availability search results for a selected period
In order to review schedules and availability for a selected period and selected users, you must
first choose a date range. You can either enter the start and end dates manually, or you can
select them from the pop up calendars by clicking on the calendar icons.
Next you must choose your search parameters for filtering your user list. These include by user
name, assignments to other Projects/Tasks, Groups, Roles or any custom user field that includes
select list options. As a result, you can set up your own attributes for use when searching for
the appropriate users to assign to a specific task.
After you have selected your search parameters for filtering your user list, click on the Search
button to view your search results and the users' availability for the selected period. Search
results include the user full name, workload graph, schedulable hours, assigned hours,
unassigned hours, % allocated and schedulable working days. The "schedulable" fields show how
much total time the user has available for project work during the selected period, regardless
of current assignments. Assigned hours shows how much of the schedulable time has been taken up
with assignments for project work, while unassigned hours show the amount of time available. %
allocation shows the percent of schedulable time is consumed by current assignments.
Aggregating Resource Availability
In addition to viewing individual resource availability metrics, you can report on aggregated
availability numbers for selected groups of users. You can view total availability for selected
Groups or Roles. You can also aggregate by selections in any user custom field that is set up as
a select list. The fields in the search results will display the total time available or
assigned for the selected groups. User Workload and Calendar Availability Graphs are not
displayed when aggregating because they are specific to individual users.
User Workload Bar Graphs
Workload bar graphs displayed in the user search results provide a visual means for comparing
user availability for a given period. These graphs allow you to determine who has the most time
available or will have to work the least amount of overtime to complete their work for the
period.
The different color blocks that make up the bar graphs represent different types of time
scheduled (see figure 37.2):
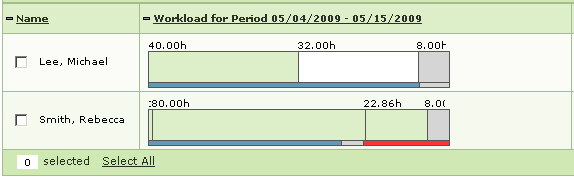
Figure 37.2.User Workload Bar Graph
- White always represents unassigned time/time available for project assignment.
Comparing user bar graphs allows you to quickly locate users with the most time available by
scanning for the largest blocks of white.
- Green represents time assigned to projects/tasks. Green blocks indicate different
project assignments. Mousing over each block provides more details on the project/task
assignment.
- Gray represents overhead time. Approved leave time, holiday time and the system
wide overhead percentage amount (if any) are all reflected in the overhead time block.
Likewise, the Schedulable Hours and Schedulable Working Days fields in the user search
results are adjusted for the various components of overhead time. All users start with a
base work day of 8 hours and a base work week of 5 days prior to overhead adjustments.
- Blue represents the total number of assigned and unassigned hours the user has
available for the period based on the base work day and work week. It does not include
overhead hours for the period, which are still shown in gray.
- Red represents the amount of overtime hours a user would have to work above and
beyond the base schedule plus overhead time in order to complete the current assignment load
on time. Just as comparing white blocks can help you to determine which users have the most
time available, red blocks allow you to quickly scan for which users have the least time
available.
Hover information is available for each block on the workload bar graphs. Hover information
provides project names, owners and schedule details for the assignments or time off.
User Calendar Availability Graphs
Availability Calendar graphs displayed in the user search results provide a visual means for
finding specific periods of full or partial availability. These graphs allow you to determine on
what dates a user has time available for project work - and how much time is available on a
given day.
The number scale on the left side of the bar shows the number of hours with the green bar height
determining how many hours are assigned on a specific date. The numbers across the top of the
bar represent the dates included in the period you defined when setting search parameters. The
green bar shows project assignment time. The gray bar shows holiday or leave time that makes the
user unavailable (see figure 37.3). Hovering over any of the bars provides detailed information
on how much time is blocked off.
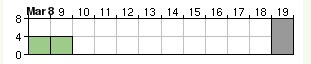
Figure 37.3.User Availability Calendar
It is also possible to view a larger and more detailed view of the availability calendar by
selecting users from the search results and clicking on the Show Detailed Calendar button at the
foot of the results. The detailed view shows the task names to the left of the graph with a
green bar extending to the right indicating how long the assignment is scheduled to take. Hover
information shows how much assignment work is scheduled per day. The height of the bar also
indicates the number of hours per day relative the other bars on the chart. When you are
finished reviewing detailed calendars, you can click on the Return to Resource Availability
button (see figure 37.4).
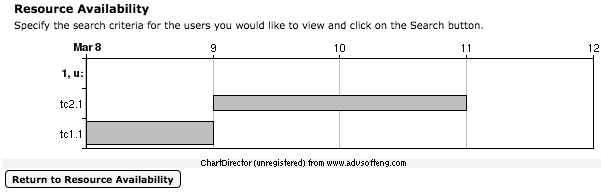
Figure 37.4.Detailed Availability Calendar